Medicare-Medicaid Enrollees Increasingly Choose Medicare Advantage Plans

The number of dual eligible beneficiaries — people who are enrolled in both Medicare and Medicaid coverage — increased from 10.4 million in 2016 to 12.8 million in 2024. And a growing share of them chose a private Medicare Advantage plan rather than a traditional fee-for-service Medicare plan, according to a recent analysis from The Commonwealth Fund.

Dual eligible enrollees typically require more intensive and costly health care than the average Medicare enrollee. To qualify as a dual enrollee, a person must be at least 65 years old or have a qualifying disability or medical condition, have a low income and limited resources. Between 2013 and 2021, the percentage of dual eligible beneficiaries covered by a MA plan more than doubled, from 24% to 51%.

According to AIS’s Directory of Health Plans, the top five insurers with the largest dual eligible memberships — UnitedHealth Group, Humana Inc., Elevance Health, Inc., CVS Health Corp.’s Aetna and Centene Corp. — accounted for almost 75% of enrollment as of June 2024. Six of the top 10 health plans saw double-digit growth year over year, while Aetna reported a membership gain of nearly 90.7%.

!function(e,n,i,s){var d=”InfogramEmbeds”;var o=e.getElementsByTagName(n)[0];if(window[d]&&window[d].initialized)window[d].process&&window[d].process();else if(!e.getElementById(i)){var r=e.createElement(n);r.async=1,r.id=i,r.src=s,o.parentNode.insertBefore(r,o)}}(document,”script”,”infogram-async”,”https://e.infogram.com/js/dist/embed-loader-min.js”);

Dual eligible beneficiaries in MA plans and in traditional Medicare, on average, reported similar ratings of satisfaction with medical care and Part D prescription drug coverage, the report showed. Most dual eligible beneficiaries were able to get needed care, while a larger percentage of enrollees covered by traditional Medicare experienced delays in care due to cost than those covered by MA.

!function(e,n,i,s){var d=”InfogramEmbeds”;var o=e.getElementsByTagName(n)[0];if(window[d]&&window[d].initialized)window[d].process&&window[d].process();else if(!e.getElementById(i)){var r=e.createElement(n);r.async=1,r.id=i,r.src=s,o.parentNode.insertBefore(r,o)}}(document,”script”,”infogram-async”,”https://e.infogram.com/js/dist/embed-loader-min.js”);

While all dual eligible enrollees receive standard Medicare benefits, they have many options for their primary health insurance, including traditional Medicare, MA and specialized MA plans for individuals with greater and specific health care needs. A Dual Eligible Special Needs Plan (D-SNP) is the most common type of specialized MA plan by far.

The type of Medicare primary health insurance that dual eligibles chose has changed significantly between 2009 and 2021, according to an Urban Institute analysis. Since January 2009, traditional Medicare has been losing dual eligible beneficiaries in all states, with Hawaii and South Carolina seeing enrollment decrease by over 50 percentage points. As of December 2021, Hawaii, Florida, Tennessee, Alabama, Louisiana, Arizona and New York reported that more than 40% of their dual eligible enrollees were covered by D-SNPs.


!function(e,n,i,s){var d=”InfogramEmbeds”;var o=e.getElementsByTagName(n)[0];if(window[d]&&window[d].initialized)window[d].process&&window[d].process();else if(!e.getElementById(i)){var r=e.createElement(n);r.async=1,r.id=i,r.src=s,o.parentNode.insertBefore(r,o)}}(document,”script”,”infogram-async”,”https://e.infogram.com/js/dist/embed-loader-min.js”);

This infographic was reprinted from AIS Health’s weekly publication Health Plan Weekly.

Cigna Sale Quadruples HCSC’s Medicare Membership

Health Care Service Corp. has completed its acquisition of The Cigna Group’s Medicare business, which significantly expanded HCSC’s footprint and boosted its Medicare enrollment.

The $3.7 billion purchase of Cigna’s Medicare Advantage, Cigna Supplemental Benefits, Medicare Part D and CareAllies businesses was announced more than a year ago. Divesting these assets “streamlines The Cigna Group’s portfolio and enables it to drive further innovation to support customers,” Cigna stated on March 19.

Cigna’s Medicare business covers more than 4.1 million lives across all states and Washington, D.C., according to the latest data from AIS’s Directory of Health Plans (DHP). Although the insurer’s total MA market share was small compared with other national competitors, it is the fourth-largest insurer in the stand-alone Medicare Part D Prescription Drug Plan (PDP) market, with over 2.9 million enrollees. With the purchase, HCSC now covers more than 5.1 million lives across the three Medicare product lines, according to DHP data.

!function(e,n,i,s){var d=”InfogramEmbeds”;var o=e.getElementsByTagName(n)[0];if(window[d]&&window[d].initialized)window[d].process&&window[d].process();else if(!e.getElementById(i)){var r=e.createElement(n);r.async=1,r.id=i,r.src=s,o.parentNode.insertBefore(r,o)}}(document,”script”,”infogram-async”,”https://e.infogram.com/js/dist/embed-loader-min.js”);

As the parent company of five Blue Cross Blue Shield insurers — serving Illinois, Montana, New Mexico, Oklahoma and Texas — HCSC is a significant player in these states, but its new acquisition gives it access to members in all states and Washington, D.C. With the addition of Cigna’s MA and Medicare PDP lives, HCSC now is the second-largest insurer in New Mexico and Texas, holding 21.8% and 18.4% of the state’s Medicare business, respectively, according to DHP data. In both Montana and Oklahoma, it ranks third with about 12.0% of the state’s market share.

!function(e,n,i,s){var d=”InfogramEmbeds”;var o=e.getElementsByTagName(n)[0];if(window[d]&&window[d].initialized)window[d].process&&window[d].process();else if(!e.getElementById(i)){var r=e.createElement(n);r.async=1,r.id=i,r.src=s,o.parentNode.insertBefore(r,o)}}(document,”script”,”infogram-async”,”https://e.infogram.com/js/dist/embed-loader-min.js”);

This infographic was reprinted from AIS Health’s weekly publication Health Plan Weekly.

As ACA Exchanges Turn 10, New HHS Reports Show How Far They’ve Come

Over the first 10 years of the Affordable Care Act marketplaces, enrollment nationwide has almost tripled, from 8 million individuals in 2014 to 21.4 million in 2024, according to an HHS report.

While the ACA initially envisioned the marketplaces to be developed by states, it also provided states with the option to participate in the federally facilitated marketplace, HealthCare.gov. In 2014, 14 states and the District of Columbia chose to operate their own state-based marketplaces (SBMs). In 2024, there are 19 SBMs.

!function(e,n,i,s){var d=”InfogramEmbeds”;var o=e.getElementsByTagName(n)[0];if(window[d]&&window[d].initialized)window[d].process&&window[d].process();else if(!e.getElementById(i)){var r=e.createElement(n);r.async=1,r.id=i,r.src=s,o.parentNode.insertBefore(r,o)}}(document,”script”,”infogram-async”,”https://e.infogram.com/js/dist/embed-loader-min.js”);

Federal policy changes have played a key role in the performance of the ACA marketplaces. In 2014, about 5.4 million people enrolled in marketplace health insurance in HealthCare.gov states and 2.6 million enrolled in SBMs. Yet between 2017 and 2020, the reduction in funding for marketing and the elimination of federal cost-sharing payments to health plans led to enrollment decreases.

But since the COVID-19 pandemic, several policies aimed at expanding health care coverage have contributed to membership increases for four consecutive years. By end of the annual open enrollment period in 2024, 21.4 million individuals had selected or were automatically reenrolled in a marketplace plan. More than 5 million people were new consumers, an increase of 41% from 2023.

!function(e,n,i,s){var d=”InfogramEmbeds”;var o=e.getElementsByTagName(n)[0];if(window[d]&&window[d].initialized)window[d].process&&window[d].process();else if(!e.getElementById(i)){var r=e.createElement(n);r.async=1,r.id=i,r.src=s,o.parentNode.insertBefore(r,o)}}(document,”script”,”infogram-async”,”https://e.infogram.com/js/dist/embed-loader-min.js”);

In the early years of the ACA, three-quarters of HealthCare.gov enrollees lived in markets with three or more health plan issuers, while 7% were in markets with only one. By 2016, only 2% of enrollees lived in markets with just a single issuer. The trend reversed in 2017, when some major national insurers — such as CVS Health Corp.’s Aetna and UnitedHealth Group — pulled back from the marketplaces, leaving over 1,000 counties in HealthCare.gov states with only one issuer in 2018.

However, the number of issuers participating in the ACA has climbed since 2019, as several insurers chose to rejoin the market and expand their coverage footprints, according to the Robert Wood Johnson Foundation’s ACA Marketplace Participation Tracker.

Centene Corp. — the country’s largest ACA exchange insurer — gained nearly 1.1 million new members from the first quarter of 2019 to 2023, according to AIS’s Directory of Health Plans. Aetna, which rejoined the marketplaces in 2022, reported year-over-year membership growth of nearly 3,122% and ranked as the fourth largest ACA insurer in 2023.

!function(e,n,i,s){var d=”InfogramEmbeds”;var o=e.getElementsByTagName(n)[0];if(window[d]&&window[d].initialized)window[d].process&&window[d].process();else if(!e.getElementById(i)){var r=e.createElement(n);r.async=1,r.id=i,r.src=s,o.parentNode.insertBefore(r,o)}}(document,”script”,”infogram-async”,”https://e.infogram.com/js/dist/embed-loader-min.js”);

Since the establishment of the ACA marketplaces, over 85% of HealthCare.gov enrollees have received subsidies to cover their premiums each year. The expansion of subsidy eligibility to enrollees with household incomes above 400% of the federal poverty level further increased the share of enrollees receiving financial assistance. By 2024, 95% of HealthCare.gov enrollees gained subsidies, according to the HHS report.

Average premiums, both before and after subsidies, began to fall in 2019, partially due to increased insurer participation. The average premium after subsidies was 17% of the gross premium in 2023, compared to 36% in 2015.


!function(e,n,i,s){var d=”InfogramEmbeds”;var o=e.getElementsByTagName(n)[0];if(window[d]&&window[d].initialized)window[d].process&&window[d].process();else if(!e.getElementById(i)){var r=e.createElement(n);r.async=1,r.id=i,r.src=s,o.parentNode.insertBefore(r,o)}}(document,”script”,”infogram-async”,”https://e.infogram.com/js/dist/embed-loader-min.js”);

This infographic was reprinted from AIS Health’s weekly publication Health Plan Weekly.

Health Insurer Executive Compensation Database, 2019-2023

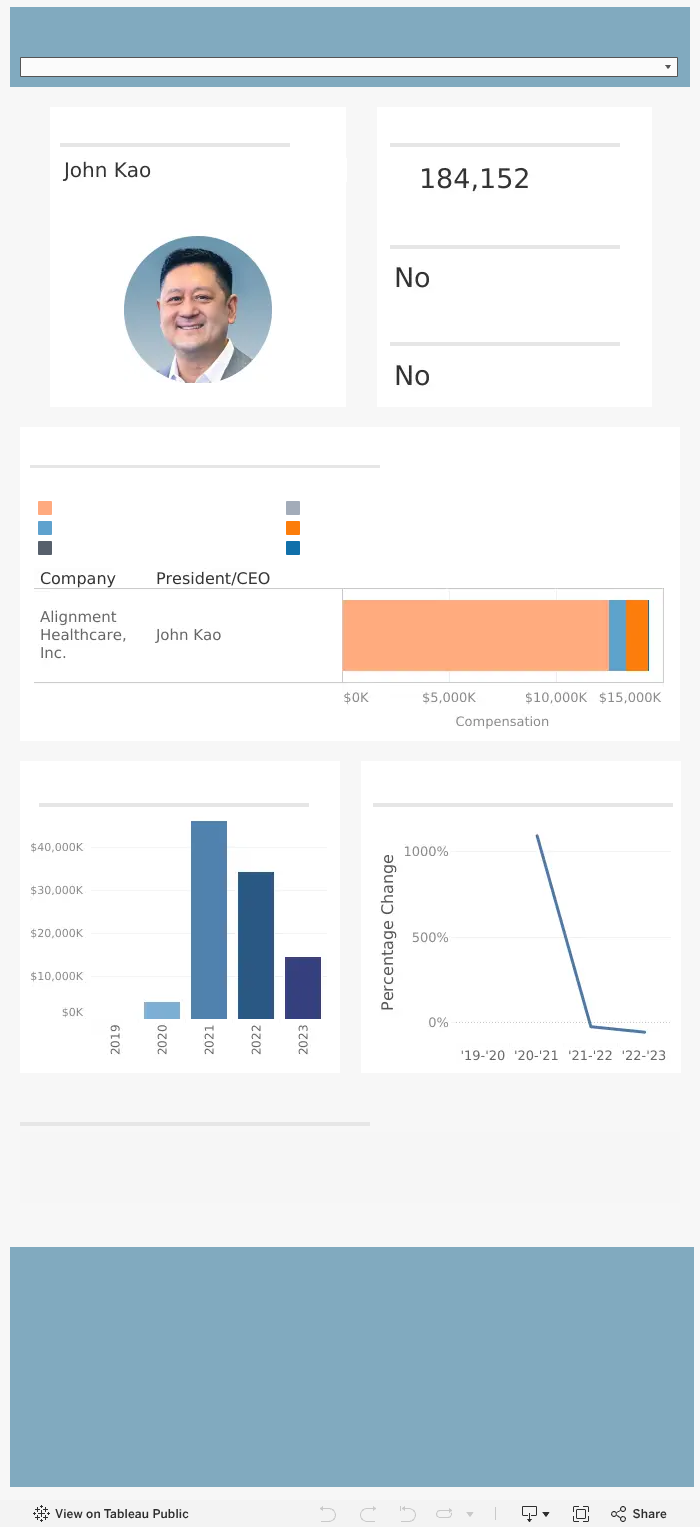
The CEOs of seven major publicly traded health insurance companies together received more than $144 million in total compensation in 2023, AIS Health’s Executive Compensation Database shows. The database includes major health insurers’ executive compensation from 2019 to 2023 — collected from individual companies, state insurance documents and U.S. Securities and Exchange Commission filings — and their national membership information as of the third quarter of 2024, per AIS’s Directory of Health Plans. The database will be updated annually.

Several states do not disclose compensation data for specific executives at health insurance companies or do not collect compensation data. Some insurance companies made leadership changes over the years.

Select or type an insurer’s name to see detailed compensation information of the firm’s CEO in 2023 and how top executives’ compensation has changed over the years. AIS Health also tracks director compensation information of health insurance companies.

Database
var divElement = document.getElementById(‘viz1739553854568’); var vizElement = divElement.getElementsByTagName(‘object’)[0]; if ( divElement.offsetWidth > 800 ) { vizElement.style.width=’700px’;vizElement.style.height=’1527px’;} else if ( divElement.offsetWidth > 500 ) { vizElement.style.width=’700px’;vizElement.style.height=’1527px’;} else { vizElement.style.width=’100%’;vizElement.style.height=’2027px’;} var scriptElement = document.createElement(‘script’); scriptElement.src = ‘https://public.tableau.com/javascripts/api/viz_v1.js’; vizElement.parentNode.insertBefore(scriptElement, vizElement);

More Commercial Health Plan Enrollees Have Copay Maximizers Than Accumulators in 2024

Copay maximizer programs are gaining popularity among payers while copay accumulators appear to be losing some of their appeal, according to the annual Copay Accumulator & Maximizer Programs Special Report published by AIS Health’s parent company, MMIT. The report was based on surveys of 35 commercial insurers and PBMs representing 121.0 million lives.

About 39% of people were enrolled in plans with copay accumulators in 2024 on average, down from 47% in 2023. And 47% of enrollees were in plans with copay maximizer programs. On average, payers anticipated that about 48% and 57% of plan members will be covered by plans with copay accumulators and maximizers within the next 12 months, respectively.

Both accumulators and maximizers prevent any monetary assistance that pharmaceutical companies offer commercially insured patients, such as copay coupons, from counting toward their deductible or out-of-pocket maximum. Copay accumulators deplete all available assistance as soon as possible, while copay maximizers distribute the total amount of a manufacturer’s copay-offset funds over 12 months, making that amount the new monthly copayment on any given drug over the course of a year.

!function(e,n,i,s){var d=”InfogramEmbeds”;var o=e.getElementsByTagName(n)[0];if(window[d]&&window[d].initialized)window[d].process&&window[d].process();else if(!e.getElementById(i)){var r=e.createElement(n);r.async=1,r.id=i,r.src=s,o.parentNode.insertBefore(r,o)}}(document,”script”,”infogram-async”,”https://e.infogram.com/js/dist/embed-loader-min.js”);

Over the past few years, state legislators have passed bills aimed at banning the use of copay accumulator programs and ensuring that any third-party copay assistance used by a patient is counted toward the cost-sharing limits of that patient’s plan. As of November 2024, 21 states and Puerto Rico have passed laws banning payer and PBM use of copay accumulator programs, up from 19 states in 2023. The legislation applies to only state-regulated health plans, including individual, fully insured large group and small group plans.

Health plans surveyed by MMIT said they commonly countered bans on copay accumulator programs by negotiating with manufacturers (56% of covered lives) and lobbying at a federal level (49% of covered lives) in 2024.

!function(e,n,i,s){var d=”InfogramEmbeds”;var o=e.getElementsByTagName(n)[0];if(window[d]&&window[d].initialized)window[d].process&&window[d].process();else if(!e.getElementById(i)){var r=e.createElement(n);r.async=1,r.id=i,r.src=s,o.parentNode.insertBefore(r,o)}}(document,”script”,”infogram-async”,”https://e.infogram.com/js/dist/embed-loader-min.js”);

A U.S. district court ruled in September 2023 that manufacturer copayment assistance must be counted toward commercially insured patients’ out-of-pocket costs unless a brand-name drug has a medically appropriate generic equivalent. While some payers surveyed by MMIT agreed with the ruling, many were concerned that it would drive up costs for insurers. So far, the Biden administration has not issued regulations to enforce the district court’s ruling.

The final 2025 Notice of Benefit and Payment Parameters (NBPP) prohibited the use of copay maximizers in non-grandfathered individual and small group market plans, but it remained silent on copay accumulators. HHS also did not address copay accumulators in the proposed 2026 NBPP, but HHS said that it and the Labor and Treasury departments plan to issue a future notice of proposed rulemaking that addresses “the applicability of drug manufacturer support to the annual limitation on cost sharing.” This omission leaves uncertainty about copay assistance programs and may lead to issues with patient adherence, payers told MMIT. However, they did not anticipate a shift back to accumulator programs as maximizers were seen as more valuable.

!function(e,n,i,s){var d=”InfogramEmbeds”;var o=e.getElementsByTagName(n)[0];if(window[d]&&window[d].initialized)window[d].process&&window[d].process();else if(!e.getElementById(i)){var r=e.createElement(n);r.async=1,r.id=i,r.src=s,o.parentNode.insertBefore(r,o)}}(document,”script”,”infogram-async”,”https://e.infogram.com/js/dist/embed-loader-min.js”);

This infographic was reprinted from AIS Health’s biweekly publication Radar on Drug Benefits.

MA-PD Deductibles Up, PDP Options Down Amid Big Policy Changes in 2025

Policy changes to the Medicare Part D benefit that were included in the Inflation Reduction Act, namely a $2,000 out-of-pocket drug costs cap, will lead to lower out-of-pocket spending for some Part D enrollees but higher costs for Part D plans overall in 2025, according to a KFF analysis.

Six in 10 enrollees in Medicare Advantage Prescription Drug (MA-PD) plans will be in a plan that charges a deductible for drug coverage if they stay in their current plan, compared with just 21% in 2024. The average drug deductible charged by MA-PD plans will increase four-fold from $59 in 2024 to $225 in 2025. In addition, a larger share of MA-PD enrollees will be in plans charging coinsurance rather than flat copayments for preferred brands and nonpreferred drugs: 28% will be required to pay coinsurance for preferred brands versus 2% in 2024, and 57% will face coinsurance for nonpreferred drugs versus 11% in 2024.

For people choosing stand-alone Medicare Part D Prescription Drug Plans, most of them (84%) will be in a PDP that charges a drug deductible in 2025, similar to the share in 2024 (87%). And three-fourths of those beneficiaries will be in a plan that charges the standard deductible of $590. About 83% will face coinsurance for preferred brands and 100% will have to pay coinsurance for nonpreferred drugs in 2025. Among the 12 national PDPs, eight PDPs will charge $0 for preferred generics in 2025, but they’ll also feature copays of $45 to $47 or coinsurance of 15% to 25% for preferred brands, and coinsurance ranging from 31% to 50% for nonpreferred drugs.

!function(e,n,i,s){var d=”InfogramEmbeds”;var o=e.getElementsByTagName(n)[0];if(window[d]&&window[d].initialized)window[d].process&&window[d].process();else if(!e.getElementById(i)){var r=e.createElement(n);r.async=1,r.id=i,r.src=s,o.parentNode.insertBefore(r,o)}}(document,”script”,”infogram-async”,”https://e.infogram.com/js/dist/embed-loader-min.js”);

The number of PDP options for beneficiaries will drop from 709 in 2024 to 464 in 2025, the lowest number of PDPs available since Part D started in 2006. The number of firms offering such plans will also decline to seven in 2025, compared with 11 companies in 2024. Over the past 10 years, the number of PDPs available to the average beneficiary has decreased by 52% while the number of MA-PD plans has increased by 143%.

In 2025, fewer premium-free benchmark plans will be available to Medicare beneficiaries who receive low-income subsidies (LIS) than in any year since 2006. On average, LIS beneficiaries will have only two benchmark PDPs to choose from in 2025.

!function(e,n,i,s){var d=”InfogramEmbeds”;var o=e.getElementsByTagName(n)[0];if(window[d]&&window[d].initialized)window[d].process&&window[d].process();else if(!e.getElementById(i)){var r=e.createElement(n);r.async=1,r.id=i,r.src=s,o.parentNode.insertBefore(r,o)}}(document,”script”,”infogram-async”,”https://e.infogram.com/js/dist/embed-loader-min.js”);

The monthly premium for PDPs is estimated to be $45 in 2025, a slight increase from $42 in 2024. Meanwhile, the monthly premium for MA-PD plans will decrease by $2 in 2025, as MA-PD sponsors can use rebate dollars to lower or eliminate their Part D premiums and offer additional benefits. On an enrollment-weighted basis, average monthly premiums for PDPs will be six times higher than MA-PD plans in 2025: $45 vs. $7.

For 2025, about 54% of non-LIS PDP enrollees will see either a reduction in their monthly premium (41%) or no change (13%) if they stay in their current plan. Of the 6 million non-LIS PDP enrollees who will see an increase in their Part D premium, 2.6 million will see an increase of $35, which is the maximum monthly premium increase allowed for PDPs participating in the Part D Premium Stabilization Demonstration.

AIS Health’s analysis of CMS data showed that PDP premiums among the 12 national plans will range from $127.23 for Humana Premier Rx Plan to $2.55 for Centene Corp.’s Wellcare Value Script in 2025. The enrollment-weighted monthly premium for Wellcare Value Script — the largest PDP by enrollment in 2024 — will increase by $3 year over year. Enrollees in two of the three PDPs sponsored by CVS Health Corp.’s Aetna will see significant premium changes, and its SilverScript Plus and SilverScript SmartSaver PDPs will consolidate into one PDP for 2025.

!function(e,n,i,s){var d=”InfogramEmbeds”;var o=e.getElementsByTagName(n)[0];if(window[d]&&window[d].initialized)window[d].process&&window[d].process();else if(!e.getElementById(i)){var r=e.createElement(n);r.async=1,r.id=i,r.src=s,o.parentNode.insertBefore(r,o)}}(document,”script”,”infogram-async”,”https://e.infogram.com/js/dist/embed-loader-min.js”);

This infographic was reprinted from AIS Health’s biweekly publication Radar on Drug Benefits.

Image

As Reform Efforts Persisted, PBM Trade Association Set Its Lobbying Record in 2023

The pharmaceutical and health products industry, which has consistently outspent all other industries on federal campaign contributions and lobbying, spent nearly $378.6 million in 2023 to further policy goals, according to data compiled by OpenSecrets.

With the 2024 presidential election around the corner, the pharma/health products industry nearly evenly distributed their donated campaign funds to Democratic and Republican lawmakers during the 2023-2024 election cycle. Among the 20 lawmakers who received the most contributions from the industry, nine are Democrats. President Joe Biden, who is running for re-election this year, topped the list, receiving over $232,000.

https://e.infogram.com/js/dist/embed.js?fHr

The Pharmaceutical Research and Manufacturers of America (PhRMA) spent $27.6 million in 2023, ranking as the top individual lobbying spender in the pharmaceutical industry and the third-largest lobbying spender in the health care sector, according to data compiled by OpenSecrets. The trade association lobbied aggressively against the Pharmacy Benefit Manager Transparency Act of 2023 (S. 127), which was sponsored by Sens. Maria Cantwell (D-Wash.) and Chuck Grassley (R-Iowa) and reintroduced in the 118th Congress. The bill aims to eliminate spread pricing and prohibit pharmacy clawbacks.

The Pharmaceutical Care Management Association (PCMA), an organization representing PBMs, spent a record $15.4 million in lobbying in 2023, nearly doubling the amount it spent in 2022. That made the association the second-largest individual lobbying spender in the pharmaceutical industry. The organization also hired more lobbyists in 2023, with 11 of its 15 registered lobbyists previously holding jobs in the federal government. One of the lobbyists, former Rep. Ryan Costello (R-Pa.), once served as a member of the House Energy and Commerce Committee and joined PCMA just before a Senate panel approved a legislative package aimed at boosting the transparency of PBM business practices in July 2023. Meanwhile, the group has launched several digital advertising campaigns to criticize “Big Pharma’s egregious pricing and anti-competitive practices” and oppose legislation that “delinks” PBM payment from drug list prices and utilization in Medicare Part D.

Lobbying spending among several major pharmaceutical companies also reached a record high in 2023. Amgen Inc. invested almost $14.3 million in lobbying, a 41% jump from 2022. The Biotechnology Innovation Organization decreased its lobbying spending by 32% compared with the previous year, as Pfizer Inc. and AbbVie, Inc. both left the trade group. AbbVie also notably parted ways with PhRMA.

[infogram id=”4cd81671-b03d-41dc-b7c6-b70c9d0c2adc” prefix=”6kP” format=”interactive” title=”Major Pharmaceutical Groups Lobbying Spending 2023″]

As bipartisan interest in changing PBM practices and lowering drug costs also persisted at the state level, the pharma industry has beefed up its influence on state-level officials and hired firms that specialize solely in state-level advocacy. According to FollowTheMoney.org, which compiled 19 states’ lobbying data, the pharma/health products industry continued to be a top spender at the state level in 2023. PhRMA spent over $2.5 million on lobbying in 12 states, followed by Pfizer with nearly $1.0 million spent in 14 states.

https://e.infogram.com/js/dist/embed.js?fHr

This infographic was reprinted from AIS Health’s biweekly publication Radar on Drug Benefits.

Where were Syrian refugees resettled in the U.S.?

Where were Syrian Refugees placed in the U.S.?
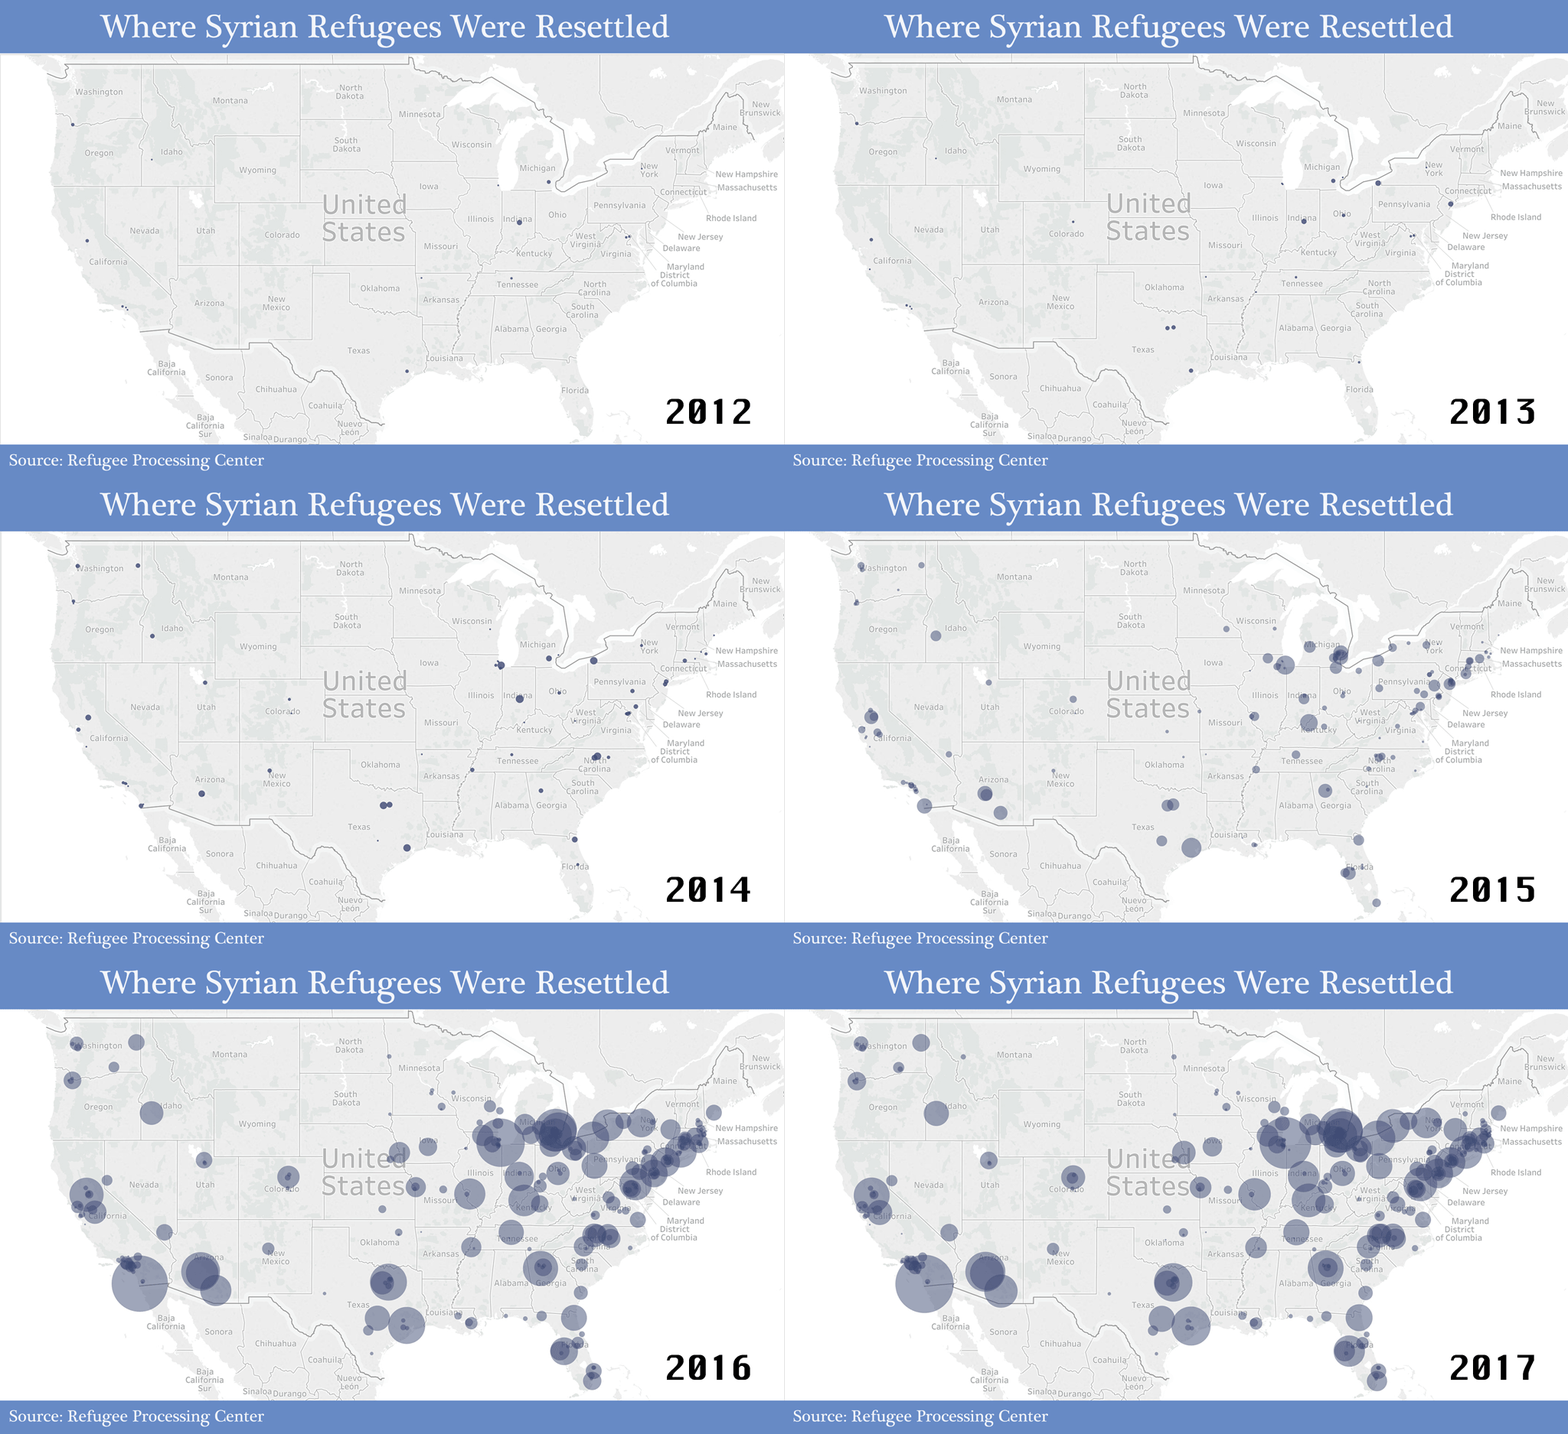
This map shows the number of Syrian Refugees admitted from Jan. 1, 2012 to April 9, 2017, and where they have been resettled in the U.S..

The refugees from Syria have been resettled in 298 cities and towns in the U.S. from Jan. 1, 2012 to April 9, 2017, according to Refugee Processing Center.

In total, the U.S. has admitted 20,375 Syrian refugees since 2012. San Diego, California hosts the largest number of Syrian refugees.

Earlier this year, President Donald Trump has signed two executive orders to halt refugee admission in the U.S., though both orders are facing court challenges.

(Map made with Excel, Tableau and Photoshop)

How safe are restaurants in Columbia

The Columbia/Boone County Public Health and Human Services performs safety inspections of every restaurant. The numbers of critical-violation and non-critical violation in the latest inspection can be explored in the map I produced: https://public.tableau.com/profile/publish/FinalProject_166/Howsafeistherestaurant#!/publish-confirm

How I made it:

1. I first used Python to scrape the data I want from The Columbia/Boone County Public Health and Human Services website.

2. I then used “agate” to analyze my data. According to my analysis, the median critical violation and median non-critical violation of Columbia restaurants are both 0, which is pretty good in general. El Tigre, a Mexican restaurant, had nine critical violations, ranking the first in the latest inspection. Among the top ten restaurants with the most critical violations, five are Asian restaurants.

In terms of non-critical violation, Chinese Wok Express ranked the first with a total of nine non-critical violations. Surprisingly, Kaldi’s Coffee ranked the fifth, which had five non-critical violations.

I then combined the critical and non-critical violations, and the data suggests that Chinese Wok Express ranked the first again with 14 violations in total. The top five unsafe restaurants consist of four Asian restaurants and one Mexican restaurant.

3. Finally, I made a restaurant map by using Tableau, and published it at: https://public.tableau.com/profile/publish/FinalProject_166/Howsafeistherestaurant#!/publish-confirm. I used the critical violation as a filter, as this is the most important part in the inspections.

Detailed steps and codes are available on my Github page.